
Detecting Bearing Defects Early with Real-Time Vibration Data: neo-pkg-bearing-analytics 1.0.0
Bearing defects appear at characteristic fault frequencies before vibration amplitude rises.
Many rotating-machine failures begin in the bearings. When a bearing race develops a flaw, each ball passing over it produces a brief impact at regular intervals. The number of impacts per second depends on the bearing geometry and rotational speed. This is called a characteristic fault frequency. In the early stages of a defect, vibration amplitude may remain almost unchanged, even though fault frequencies have already begun to appear in the signal.
neo-pkg-bearing-analytics diagnoses bearings by finding these fault frequencies in vibration data. This is a well-established method that specialists have used for years, but it has traditionally required dedicated diagnostic equipment and expert personnel. This package brings the same approach directly to vibration data accumulating in Machbase Neo in real time. No queries or code are needed: just enter each machine's rotational speed and bearing model number.
Early detection of bearing problems lets you service equipment during planned maintenance instead of waiting for an unexpected shutdown.
Why vibration amplitude alone is not enough
A common approach to vibration monitoring is to set an amplitude threshold and trigger an alarm when vibration exceeds it. Although simple, this approach has two limitations when it comes to protecting bearings.
1. Too many false alarms. Heavily loaded or inherently noisy machines can vibrate strongly even when they are healthy. High vibration means that something may be wrong; it does not necessarily mean the bearing is damaged.
2. Detection comes too late. Bearing damage starts with a tiny flaw. Its impacts are initially so small that they are buried in the overall vibration. By the time amplitude rises noticeably, the defect may already be well advanced.
That is why specialists first look for characteristic bearing fault frequencies rather than vibration amplitude alone. Once the rotational speed and bearing information are configured for each machine, this package uses the vibration data stored in Neo to perform the analysis that previously required a specialist with diagnostic equipment.
Key features of neo-pkg-bearing-analytics
1. Finding fault frequencies — identifying suspected damage locations
The illustration below shows how these impacts arise. Just as a stone stuck in a car tire makes a click on every revolution, a ball passing over a flaw produces an impact at regular intervals.

The fault frequency differs depending on whether the flaw is on the outer race, the inner race, or a rolling element. The frequencies that appear therefore help identify which part may be damaged.
These impacts are often hidden within other vibrations. The package first filters the high-frequency band where the impacts stand out, then extracts the frequencies at which they repeat. It is similar to picking out one particular sound in a noisy factory.

The screen above shows this package analyzing an outer-race defect using XJTU-SY bearing run-to-failure data published by Xi'an Jiaotong University in China. Peaks line up at the predicted fault frequency of 115.6 Hz, calculated from bearing geometry and rotational speed, and at its second and third harmonics. This pattern is the signature of an outer-race defect.
2. Condition ratings — fault frequencies trigger escalation, amplitude determines severity
There are four condition ratings: Good, Caution, Danger, and Critical. Two criteria serve different roles in determining them.
Fault frequencies — whether to raise the rating: A characteristic bearing fault frequency triggers escalation. If no such frequency is detected, the rating remains Good regardless of vibration amplitude.
Vibration amplitude — how far to raise it: ISO 10816 divides acceptable vibration levels by machine size into zones ranging from A, typical of newly commissioned equipment, to D, where damage is a concern. Once a fault frequency triggers escalation, this zone determines the severity.

If vibration is high but no fault frequency is detected, the screen states that fact separately without raising the bearing rating: the cause may lie elsewhere. Conversely, if a fault frequency appears while amplitude is still low, the rating rises to Caution. This is precisely the kind of early defect the package aims to catch.
The report below is for the same run-to-failure bearing. Clear fault frequencies triggered escalation, and vibration had also reached zone C, resulting in a Danger rating.

The effect of this decision method can be checked against public datasets. We selected 100 healthy and 283 damaged bearing records, 383 in total, from four datasets published by universities and research institutions: CWRU, MFPT, Paderborn, and XJTU-SY. We compared the results while changing only the decision criteria.

These measurements all came from bearing test rigs, where even healthy bearings can produce substantial vibration. Amplitude-only criteria therefore did little to distinguish healthy bearings from damaged ones. They raised alarms for 69 of the 100 healthy records while detecting only 37% of damaged bearings.
Combining several criteria did not solve the false-alarm problem. Detection of damaged bearings rose to 74%, but the false-alarm rate remained at 69%.
Requiring a fault frequency before raising the rating reduced false alarms to 3% while detecting 65% of damaged bearings. The method also correctly identified the damaged component in slightly more than half of the damaged records, about 54%. We prioritized reducing false alarms because operators need to trust the alarms if they are to keep using the system.
We also checked how early the package could warn of failure. In NASA bearing run-to-failure tests, it first alerted to an outer-race defect about three days before failure and a rolling-element defect about 25 days before failure. These results were validated on public test-rig data; they have not yet been validated on data from operating equipment in the field.
The package uses signal and statistical analysis rather than AI training, so there is no need to collect a training dataset for each machine. Enter the rotational speed and bearing model number, and condition ratings can begin that day.
3. Monitoring — every machine on one screen
When you open the app, each selected machine appears as a card. Its current vibration value, one-minute trend, and condition rating update in real time. Machines in poorer condition move to the front.
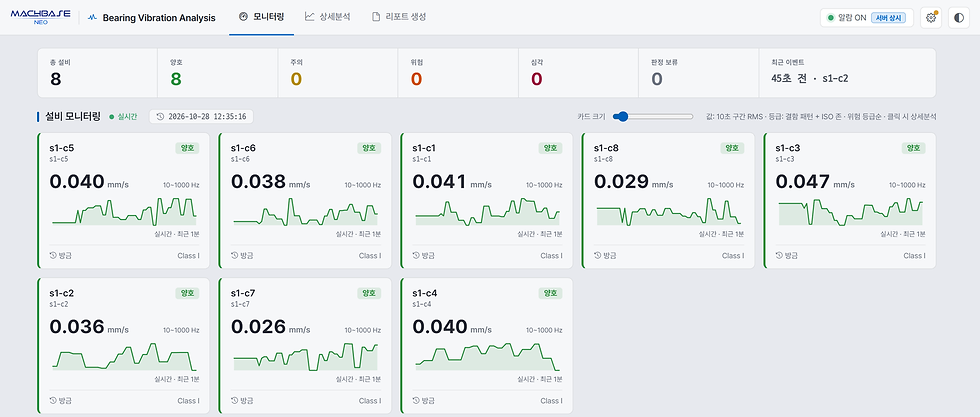
The assessment-pending count in the summary at the top shows how many machines cannot currently be rated. A machine is marked as pending if it has stopped, its signal is missing, sensor readings are abnormal, or rotational speed or bearing information is missing. Labeling an unassessable machine as Good would provide reassurance where none is warranted.
Monitoring is not limited to the time the app is open. When server monitoring is enabled, the Neo server continues the same assessment process, recording results and sending notifications even after the app is closed. The app also indicates if monitoring stops or falls behind, so silence does not leave you wondering whether monitoring has stopped.

4. Detailed analysis — evidence and recommended actions
Clicking a card opens detailed analysis for that machine. You can view the raw vibration waveform and several frequency-domain graphs on one screen. Characteristic fault frequencies are marked in advance, making it easy to check whether peaks appear at those positions. The following screens show detailed analysis of the same run-to-failure bearing.
Assessment card and comprehensive analysis — the evidence and what to do next
The assessment card at the top summarizes how the bearing fault pattern and vibration amplitude determine the rating, for example, "Fault pattern detected + ISO zone A → Caution." A one-line recommended action appears directly below. Expanding the comprehensive analysis reveals the evidence behind the assessment and detailed steps tailored to the result. The assessment itself does not use AI, so the same data always produces the same result. If desired, you can add detailed commentary from an AI provider: Claude, OpenAI, Gemini, or Ollama.

RMS trend — how vibration amplitude changes over time
Vibration amplitude increases in stages, reaching the highest zone shortly before failure.

Raw waveform — vibration exactly as measured by the sensor
Unprocessed sensor readings let you see the individual impact spikes directly.

FFT frequency spectrum — vibration separated by frequency
Markers at the rotational frequency and characteristic fault frequencies make it easy to see which components are strongest.

Spectrogram — frequency changes over time
Brighter colors indicate stronger components, showing which frequency bands began growing and when.

Detailed analysis also includes indicators that examine bearing defects from other angles: how sharply impacts stand out, through Crest Factor and kurtosis trends; whether energy in fault-related bands is growing, through fault-band energy trends; and which frequency bands contain the strongest impacts, through band-by-band impulsiveness.
5. Reports and notifications
A report is a single HTML file generated with one click. It opens in a browser without additional software, supports zooming into charts, and can be printed or saved as a PDF using the print button at the top.

The report has two tabs: Summary and Full Analysis. The Summary is designed to be read in 30 seconds. It starts with the rating and assessment, followed immediately by a one-line recommended action, key measurements, suspected defects, and detailed steps. It also states the limits of the assessment, distinguishing what the measurement cannot reveal in principle, what was checked but not found, and what signals remain unexplained. Full Analysis presents all charts and evidence in sequence, including severity, trends, spectra, defect evidence, and detailed actions.
Notifications are sent when conditions change, such as a rating change or a lost signal. To avoid a flood of alerts from brief spikes, a rating change must be confirmed in two consecutive assessments before a notification is sent. A one-off spike is only recorded. Notifications can go to messaging services such as Slack, Discord, and Google Chat. If email or SMS is needed, an automation tool can relay them.
Getting started
Requirements — Machbase Neo 8.7.3 or later and a TAG table receiving vibration sensor data. ROLLUP configuration is recommended: without it, long-term trends are limited to a recent time window and server monitoring does not operate.
Preparation — After installing the package in Neo, an administrator creates its storage in the app settings and grants each user package access and read access to the tables to be analyzed. Issue an API token in Neo for each user account and enter it in the app.
Start — Select the vibration data table and enter each machine's rotational speed and bearing model number to begin assessments immediately. Notifications require the same rating to be confirmed in two consecutive cycles, normally 10 minutes apart, so the first notification can arrive no earlier than 10 minutes later.
Optional — Enable notifications, server monitoring, and AI commentary as needed.
Recommended — On first deployment, run assessments without notifications to check how well they fit your equipment before enabling alerts.
Detailed instructions and validation results are provided in English, Korean, and Japanese manuals — \
Closing thoughts
The package is built around one idea: defects appear in frequency before they appear in amplitude. It therefore asks first whether characteristic bearing fault frequencies are present, rather than simply whether vibration is high, and raises the rating only when supporting evidence exists.
Every assessment is accompanied by its evidence. We believe a tool must show why it reached a conclusion to earn trust in the field. It is intended to help inspectors look in the right place sooner and more accurately, rather than to replace them.
Version 1.0.0 is the first step. It currently diagnoses bearings using vibration measured by a single sensor in one direction. Suspected causes are therefore presented as hypotheses, and the limitations of a single-direction measurement are stated in both the app and reports. We plan to add analysis combining measurements from multiple directions—horizontal, vertical, and axial—to strengthen the evidence for bearing diagnosis. The approach has demonstrated results on test-rig data but has not yet been validated on operating equipment in the field. Please share your results and feedback from using it so we can continue improving the package.


